According to the Bureau of Transportation Statistics, Americans spent more than a trillion dollars on their cars in 2020, with gas and oil taking up more than $228 billion of that total. [1]
This isn’t surprising, since there were about 272 million private and commercial vehicles in the U.S. in 2020. [2]
How many people in the U.S. own a car?
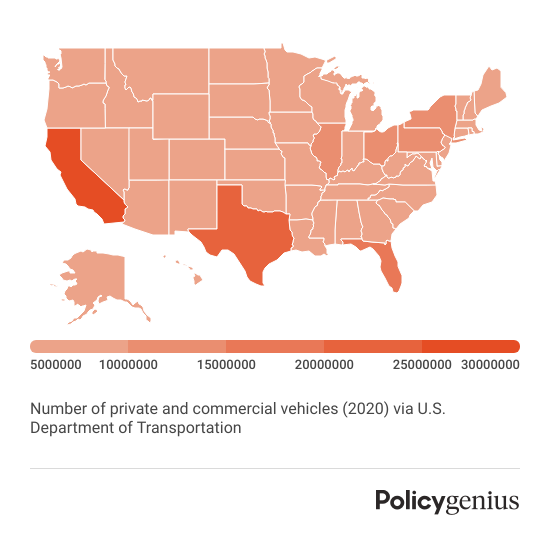
According to the U.S. Department of Transportation, there were 275,913,237 registered vehicles in the United States in 2020. California had the most registered vehicles, and Washington D.C. had the least.
State | Number of registered vehicles |
5,208,055 | |
773,487 | |
5,994,049 | |
2,873,523 | |
29,772,776 | |
5,289,701 | |
2,861,733 | |
1,000,965 | |
319,157 | |
18,170,725 | |
8,670,440 | |
1,222,626 | |
1,906,586 | |
10,489,500 | |
6,174,483 | |
3,747,148 | |
2,587,402 | |
4,364,808 | |
3,771,473 | |
1,105,912 | |
4,134,474 | |
5,021,482 | |
8,378,579 | |
5,638,650 | |
2,044,918 | |
5,531,016 | |
1,948,225 | |
1,888,168 | |
2,525,687 | |
1,346,800 | |
5,944,293 | |
1,755,205 | |
11,259,986 | |
8,595,707 | |
880,524 | |
10,481,200 | |
3,708,789 | |
4,014,446 | |
10,563,010 | |
849,912 | |
4,356,396 | |
1,271,188 | |
5,699,910 | |
22,100,167 | |
2,443,052 | |
596,297 | |
7,464,143 | |
7,068,917 | |
1,617,933 | |
5,532,287 | |
845,095 |
The number of cars in each state varies but, surprisingly, the number isn’t necessarily impacted by the number of people living in the state.
For example, there were more than 19 million people living in New York in 2020 and only 11,259,986 cars, which means there was one car for every two people. Alabama, however, had more cars than people, with 4.9 million people living in the state and 5,208,055 cars.

Source: US Department of Transportation Federal Highway Administration [3]
What percentage of Americans don't own cars?
From 2017 to 2021, less than 10% of households did not have access to a vehicle, while more than 20% of households had more than two cars. [4]
Number of vehicles per household | Percentage of households |
None | 8.30% |
One vehicle | 32.50% |
Two vehicles | 37.10% |
Three or more vehicles | 22.10% |
Source: U.S. Census [5]
The percentage of households with three or more cars is almost three times higher than the percentage of households with no vehicles available.
People with access to high quality public transportation are less likely to own a car, while people living in areas without public trains or buses are more likely to own at least one car.
Not owning a car doesn’t necessarily mean you don’t have access to a car; many people borrow cars from relatives or regularly use car rental programs like Zipcar as a form of transportation.
→ Learn about non-owner car insurance
Most popular car colors
According to Edmunds, one out of every four cars sold is white, making it the most popular car color in the United States. Yellow and purple make up the least popular color for cars, each representing only 0.2% of cars sold each year.
Rank | Color | Total Percentage |
1 | White | 24.90% |
2 | Black | 20% |
3 | Gray | 19.20% |
4 | Silver | 12.60% |
5 | Blue | 10% |
Source: Edmunds [6]
Most popular car brands in the U.S.
In 2022, Ford and Toyota were the most popular car brands in the United States. The least popular car brands were Lucid and Fiat, both of which sold less than 2,000 cars last year.
The chart below shows the top ten best selling car brands in the U.S. in 2022:
Vehicle make | Number sold in 2022 |
Ford | 1,764,267 |
Toyota | 1,755,552 |
Chevrolet | 1,512,875 |
Honda | 881,201 |
Hyundai | 716,911 |
Jeep | 684,613 |
Nissan | 682,749 |
Kia | 678,485 |
Subaru | 556,581 |
Ram | 545,195 |
Source: GoodCarBadCar [7]
Electric vehicle ownership by state
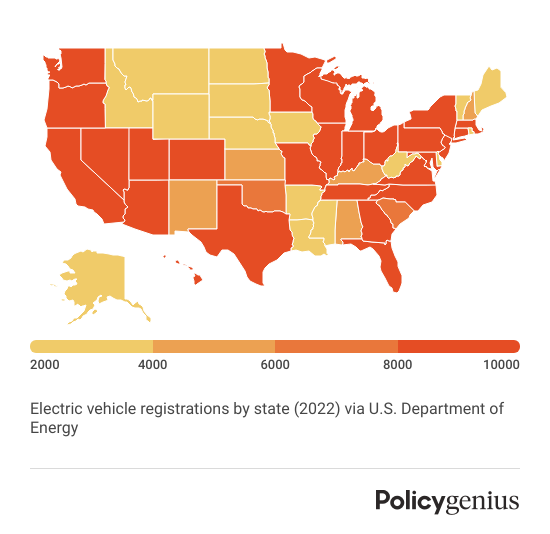
Government subsidies and incentives for purchasing an electric car, as well as the increased presence of electric car charging stations, are helping increase the number of electric cars on the road. Here are the five states with the most registered electric vehicles:
California (563,070 EVs)
Florida (95,640 EVs)
Texas (80,900 EVs)
Washington (66,810 EVs)
New York (51,870 EVs)
California has about 39% of the total number of EVs in the nation. On the other end of the spectrum, North Dakota only has 380 registered EVs, which means they have the fewest electric cars on the road.

Source: U.S. Department of Energy Alternative Fuels Data Center [8]
States that want to encourage EV ownership often create laws designed to support EV use, so drivers who are interested in purchasing an electric car should look into the laws in their state to see what type of laws, subsidies, and other financial incentives are available to them.
→ Learn about the best and worst states to own electric vehicles


